Pursuant to the General Data Protection Regulation (“GDPR”) of European Union, we are committed to protect your data and put you in control. We have updated and will periodically update our Privacy Notice in line with GDPR. See our latest version of the Privacy Notice.
This site uses cookies to offer you a better browsing experience. Find out more on how we use cookies here.


Climate Action

The Company upholds sustainable development principles and actively responds to climate change-related risks and opportunities. Since becoming a supporter of the Task Force on Climate-related Financial Disclosures (TCFD) in 2022, the Company has conducted annual disclosures in accordance with the TCFD framework. Disclosure scope is consistent with this report and cover the four core pillars of governance, strategy, risk management, and metrics and targets. Through systematic assessment of climate-related impacts on operations, the Company formulates mid- to long-term decarbonization and adaptation strategies aligned with its 2050 net-zero target.
In 2025, the Company participated in the Carbon Disclosure Project (CDP) assessment on a consolidated basis and received a B rating in both the Climate and Water Security modules. Subsidiaries Getac Technology and Getac Vietnam also achieved the same rating in the Climate module, demonstrating the Group’s progress in climate governance.
Climate Governance Framework
The Company has established a top-down climate governance framework, with the Board of Directors serving as the highest oversight body. The Board authorizes the Sustainable Development Committee to oversee climate-related risks and opportunities, while management teams and operating sites are responsible for implementation and execution, ensuring clear accountability and a closed-loop management mechanism for climate-related issues. For details, please refer to Section 2.4 Sustainability Governance Framework and Operations of the 2025 Sustainability Report.
Climate Risk and Opportunity Management
The Company has integrated the identification, assessment, and management of climate-related risks and opportunities into its Enterprise Risk Management (ERM) framework. Under the existing governance structure, the Board of Directors, Sustainable Development Committee, Risk Management Team, Climate Change Risk Team, and subsidiary management teams each perform designated responsibilities to ensure a consistent and systematic approach to managing climate-related risks and opportunities.
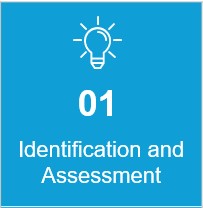 |
The Climate Change Risk Team follows the existing risk management procedures to conduct regular climate-related risk and opportunity identification and assessments every two years, with rolling updates performed in response to changes in the external environment. The assessment covers policy and regulatory, market, technological, and physical risks, while also incorporating climate-related opportunities, including low-carbon product development, energy transition, and changes in market demand. Through cross-business group and cross-functional participation, the Company consolidates risk and opportunity information from subsidiaries to ensure that the identification results reflect the Group’s overall operating context. |
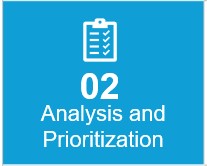 |
Identified climate-related risks and opportunities are evaluated and prioritized based on likelihood of occurrence and impact severity. The Company further assesses their potential impacts on operations, strategic planning, and financial performance, including revenue, costs, capital expenditures, and asset values, as a basis for subsequent management decisions and resource allocation. |
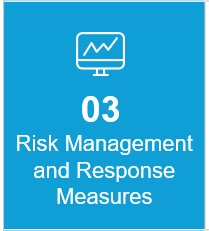 |
For risk management and response, each business unit formulates specific risk mitigation strategies and opportunity development plans based on identification and assessment results, including energy-saving and carbon reduction measures, renewable energy adoption, low-carbon product design, and supply chain management. Management teams are responsible for implementation and progress tracking. The Risk Management Team and Climate Change Risk Team consolidate implementation progress across business units and integrate the identification, assessment, prioritization, and monitoring of climate-related risks and opportunities into the existing ERM framework, ensuring a consistent management approach and standards across all operational risks. |
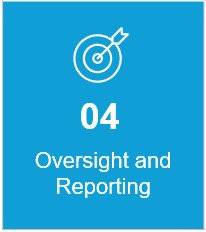 |
Relevant risk assessment results and implementation progress are regularly reported to the Sustainable Development Committee for review, and subsequently consolidated and reported to the Board of Directors for oversight and decision-making, ensuring climate-related risks and opportunities are incorporated into the Company’s overall strategy and major decision-making processes. In addition, the internal audit unit has incorporated climate risk and opportunity management, as well as related disclosure processes, into the annual audit plan. Regular reviews are conducted on the design and effectiveness of internal control systems, and improvement recommendations are provided to continuously enhance the effectiveness of the Company’s climate risk management framework. |
Scenario Analysis
In accordance with the TCFD framework, the Company has adopted climate scenario analysis as a key tool for identifying and assessing climate-related transition risks, physical risks, and opportunities. Scenario development references the IPCC AR6, decarbonization policy pathways in key operating regions (Taiwan, China, and Vietnam), and global climate trends to establish multiple climate scenarios. The Company also applies a worst-case scenario for stress testing to assess the potential impacts of extreme weather events and low-carbon transition on operations and the value chain. The results serve as key references for operational strategy adjustments, resource allocation, and mid- to long-term climate risk management, with methodologies and disclosures continuously refined in alignment with IFRS Sustainability Disclosure Standards. For details on the scenario analysis, please refer to Section 4.1 Climate Governance of the Company’s 2025 Sustainability Report.
Risk and Opportunity Identification Results
In 2025, based on climate-related risk and opportunity identification and scenario analysis results, the Company identified seven material climate risks and two climate-related opportunities. To assess potential impacts across different time horizons, risks and opportunities were categorized into short-term (within 2 years, 2025–2026), medium-term (3–6 years, 2027–2030), and long-term (over 7 years, 2031–2050). The Company evaluated each item based on likelihood of occurrence and impact severity, with the combined score used to determine prioritization and management focus. A value chain perspective was also incorporated to assess the scope of impacts and potential operational implications. Assessment results are reviewed annually and updated through a rolling review mechanism to ensure timely reflection of changes in the operating environment and evolving climate scenarios.
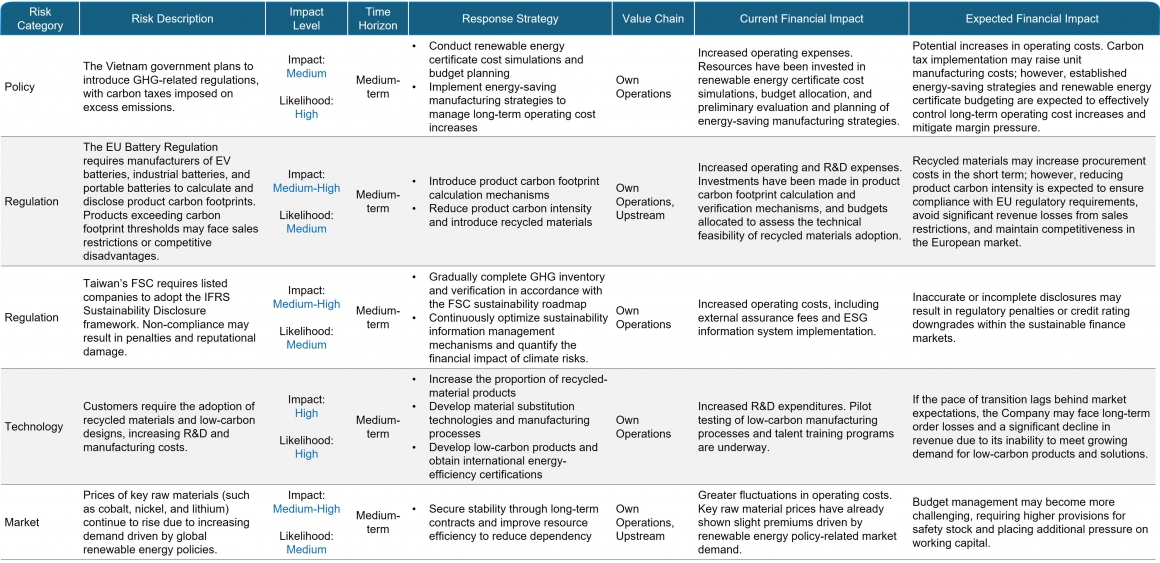
Click the picture to enlarge▲
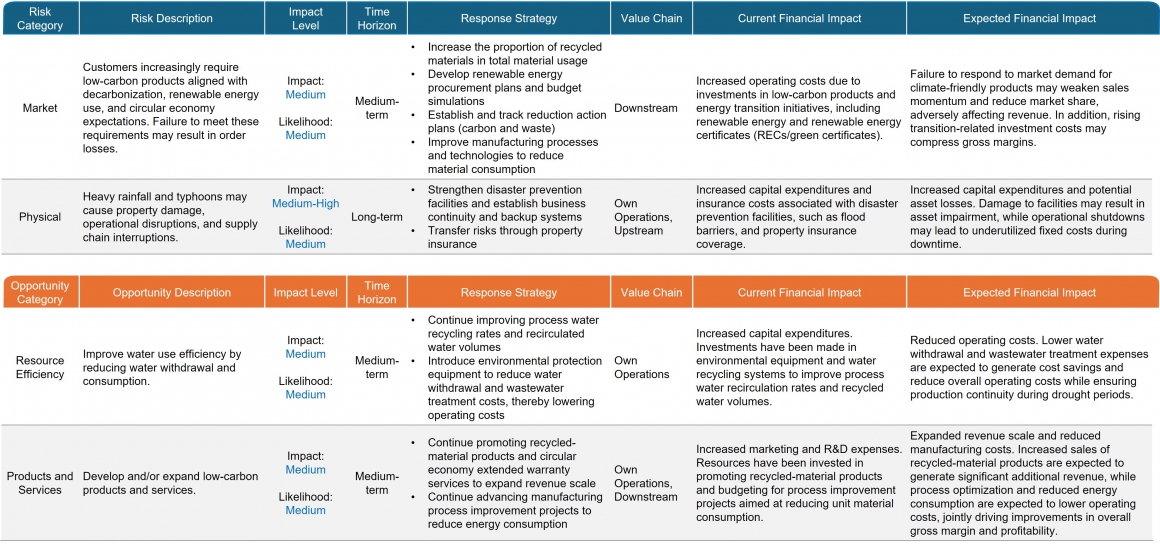
Click the picture to enlarge▲
Financial Impact Assessment
Based on the identification results of climate-related risks and opportunities, the Company assesses the potential impacts of extreme climate events (physical risks) and climate transition actions (transition risks) on its business operations, development strategies, and financial performance, and conducts analyses over the short term (1–2 years), medium term (3–6 years), and long term (over 7 years). For details on the assessment of the financial impacts of climate-related risks and opportunities, please refer to Section 4.1 Climate Governance of the Company’s 2025 Sustainability Report.
Climate Adaptation and Mitigation Actions
To improve energy efficiency, the Company aims to reduce energy intensity year by year by integrating climate considerations into daily operations and business processes. Energy-saving and carbon reduction initiatives include process optimization, equipment upgrades, implementation of smart control systems, operational efficiency improvements, reduced material usage, energy recovery and reuse, development of low-carbon products, and the adoption of renewable energy. Reduction targets and performance are regularly reviewed and tracked. In 2025, the Company implemented 34 energy-saving projects, including 12 projects carried over from 2024 to 2025 and 22 newly added projects. A total of NT$32.38 million was invested in new energy-saving molding machines, the upgrade and replacement of air compressors with variable-frequency models, constant-pressure water supply system retrofits with inverters, and energy-saving renovation works for holding furnaces.
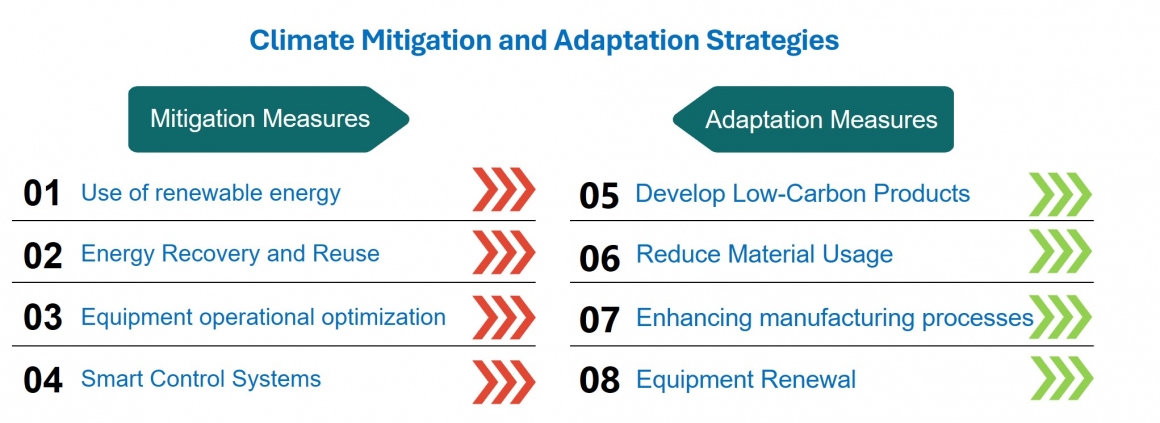
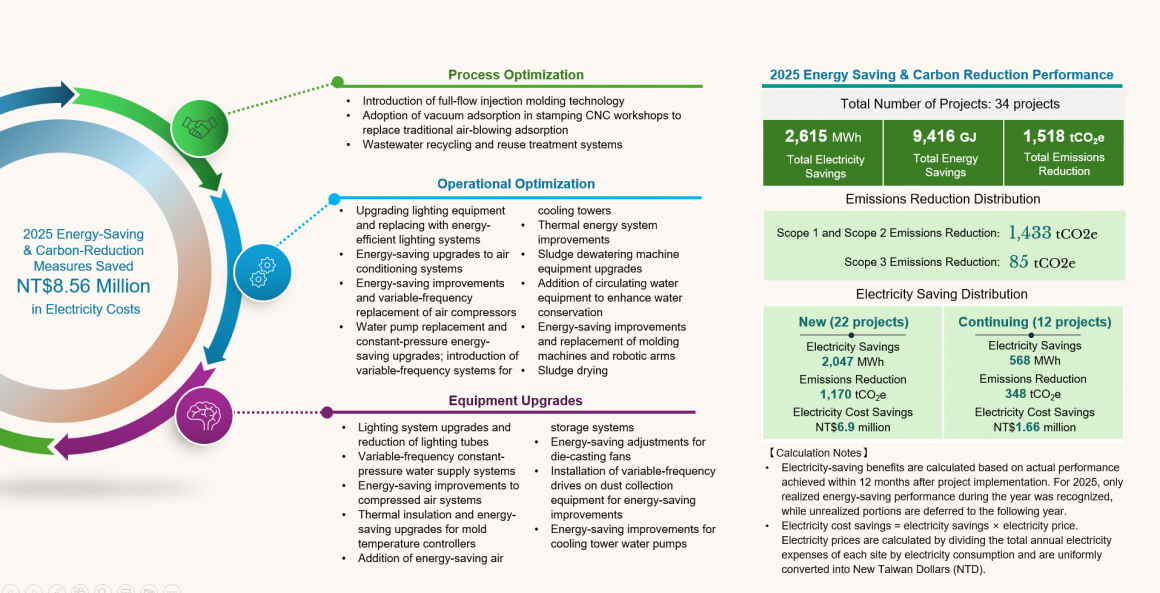
Click the picture to enlarge▲
Climate Targets and Metrics
| Medium-term Climate Targets | |
| Target Year | Climate Target |
| 2026 |
|
| 2030 | Total emissions (Scope 1 and Scope 2) decreased by 25% compared with the base year. |
To address the long-term challenges posed by climate change to business operations and resource allocation, the Company promotes climate mitigation and adaptation initiatives across multiple areas, including energy use, process management, product design, and material adoption, and has established medium- and long-term climate management targets.
Relevant climate metrics and performance results are regularly reviewed by the Sustainable Development Committee and reported to the Board of Directors to strengthen Board oversight of climate performance and related risks.
The Company uses 2021, the year in which all major subsidiaries completed GHG inventory and verification, as the baseline year for setting its short-, medium-, and long-term climate targets. The 2025 climate targets and performance results are summarized in the table below.
| 2025 Target | 2025 Performance | Status |
| Reduce Scope 1 + 2 emissions by 12.5% from the baseline year | Scope 1 + 2 emissions totaled 121,655.214 tCO₂e, down 10.6% from the baseline year | - |
| Reduce Scope 1 + 2 emissions intensity by 24.4% from the baseline year | Emissions intensity was 95.992 tCO₂e per million USD, down 24.21% from the baseline year | - |
| Reduce purchased energy consumption by 14% from the baseline year | Purchased energy consumption was 707,006.97 GJ, down 7.25% from the baseline year | - |
| Energy savings from energy efficiency projects account for 1% of total energy consumption | 1.04% | V |
| Carbon reduction from decarbonization projects accounts for 0.1% of total emissions | 0.19% | V |
| Renewable energy accounts for 0.5% of purchased electricity | 0.56% | V |
| Obtain Energy Star certification for 12 rugged computer products | 12 rugged computer products obtained Energy Star certification | V |
| Achieve 42% ISO 50001 certification coverage across global operating sites | 42%; 6 operating sites certified | V |
| Recycled plastic content accounts for 20% by weight | 23% | V |
| Recycled metal content accounts for 70% by weight | 72% | V |
| Recycled materials account for 63% of total material usage | 54% | - |
| Maintain process water recycling rate above 95% | 95.5% | V |
Energy Management
Energy Management and Renewable Energy Initiatives
Energy Management and Efficiency Improvement
The Company continues to strengthen its energy management framework through energy structure optimization, equipment and process improvements, and enhanced energy efficiency to systematically reduce reliance on carbon-intensive energy sources. In recent years, total non-renewable fuel consumption has shown a downward trend, reflecting the gradual effectiveness of energy efficiency improvements and fuel substitution measures. Meanwhile, as operational scale expands, demand for purchased electricity and steam has increased accordingly. The Company manages these increases through its energy management mechanisms and continuously monitors their impacts on the overall energy structure.
Energy Performance and Intensity Management
Despite increased operational activity, overall energy intensity remained relatively stable, indicating that energy-saving measures partially offset the additional energy demand associated with business growth.
Energy Management System Implementation (ISO 50001)
The Company has implemented and obtained ISO 50001 Energy Management System certification at several operating sites, including Huntwell, Getac Kunshan, MPT Kunshan, MPT Suzhou, and Getac Changshu (including the Kunshan branch). Through the establishment of energy performance indicators, management of major energy-consuming equipment, and continuous improvement mechanisms, the Company has strengthened energy monitoring and management capabilities. Vietnam sites are scheduled to implement ISO 50001 in 2026.
Renewable Energy Adoption and Strategic Planning
The Company currently does not use biofuels or conduct self-generation of electricity and does not produce or sell electricity, heating, cooling, or steam externally. Renewable energy adoption has been incorporated into the Company’s medium- and long-term energy and decarbonization strategy. Starting in 2025, the Company began progressively promoting renewable energy procurement, with Getac Technology and MPT Kunshan taking the lead in implementation. In the future, the Company will progressively establish medium- and long-term renewable energy adoption targets based on the electricity consumption characteristics of each operating site, local regulatory environments, and market maturity. The Company will also evaluate diversified procurement approaches, including Power Purchase Agreements (PPAs) and Renewable Energy Certificates (RECs), to balance energy supply stability, cost efficiency, and decarbonization performance.
2025 Energy Consumption
In 2025, the Company’s total energy consumption reached 903,287.445 GJ, representing an increase of 13.97% year-over-year and a slight increase of 0.77% from the baseline year. The increase in energy consumption was primarily attributable to business expansion and the inclusion of two additional subsidiaries within the reporting boundary.
Energy Intensity and Efficiency Performance
In 2025, the Company’s energy intensity was 712.737 GJ per million USD, down 0.08% year-over-year and 14.60% from the baseline year, reflecting continued improvement in overall energy efficiency. During the year, the Company implemented 34 energy-saving and carbon reduction projects, reducing purchased energy consumption (natural gas and electricity) by approximately 2,615 thousand kWh. Details of energy reduction performance are provided in Section 4.1 Climate Action of this report.
From an energy mix perspective, non-renewable fuel intensity was 154.875 GJ per million USD, down 5.15% year-over-year, while purchased energy intensity (electricity and steam) was 557.862 GJ per million USD, up 1.42% year-over-year, remaining the primary energy source. Overall, although energy consumption increased with business expansion, the Company continued to improve energy efficiency through continuous energy-saving initiatives. Going forward, the Company will continue reducing reliance on purchased energy and progressively increase renewable energy adoption to lower energy intensity and support its low-carbon transition.
Energy Consumption Analysis Table
| Category | Unit | 2023 | 2024 | 2025 |
| Diesel | Kg | 263,283 | 245,706 | 233,067 |
| Natural Gas | m3 | 2,502,398 | 2,118,617 | 2,277,849 |
| LPG | Kg | 1,963,627 | 2,012,652 | 2,019,979 |
| Gasoline | Kg | 78,399 | 82,563 | 73,341 |
| Purchased Electricity-Renewable | kWh | 0 | 0 | 874,000 |
| Purchased Electricity-Conventional | kWh | 130,271,517 | 136,608,555 | 155,325,051 |
| Purchased Steam | mt | 41,920 | 42,644 | 51,694 |
Energy Consumption and Intensity Analysis Table
| Item | 2023 | 2024 | 2025 | |
| Energy Consumption (GJ) |
Diesel | 11,326.249 | 10,552.729 | 10,017.469 |
| Natural Gas | 84,541.023 | 72,058.156 | 88,122.965 | |
| LPG | 90,519.732 | 95,198.440 | 94,939.027 | |
| Gasoline | 3,439.063 | 3,609.738 | 3,201.010 | |
| Total Non-Renewable Fuel Consumption | 189,826.067 | 181,419.063 | 196,280.471 | |
| Purchased Electricity-Renewable | 0 | 0 | 3,146.400 | |
| Purchased Electricity-Conventional | 468,977.460 | 491,790.799 | 559,170.183 | |
| Purchased Steam | 117,333.867 | 119,325.595 | 144,690.391 | |
| Total Purchased Energy | 586,311.328 | 611,116.394 | 707,006.974 | |
| Total Energy Consumption | 776,137.395 | 792,535.457 | 903,287.445 | |
| Energy Intensity (GJ per million USD) |
Non-Renewable Fuel Intensity | 169.975 | 163.287 | 154.875 |
| Purchased Energy Intensity | 524.998 | 550.037 | 557.862 | |
| Total Energy Intensity | 694.974 | 713.324 | 712.737 | |
Greenhouse Gas Emissions Management
Greenhouse Gas Inventory and Carbon Management
The Company conducts greenhouse gas (GHG) inventories in accordance with the ISO 14064-1 standard. The inventory scope covers Scope 1 (direct emissions) and Scope 2 (energy indirect emissions), while continuously expanding the categories and data completeness of Scope 3 value chain emissions. All operating sites have completed third-party verification under ISO 14064-1, covering all entities disclosed in this report to ensure consistency and reliability in inventory methodologies, boundary settings, and data quality. Certain subsidiaries have additionally adopted GHG Protocol inventory and verification mechanisms as an important foundation for alignment with IFRS Sustainability Disclosure Standards.
Inventory Boundary and Governance Mechanism
The inventory boundary is defined based on major operating sites included in the consolidated financial statements, using the Operational Control Approach to determine reporting entities and ensure consistency with the financial reporting boundary. Inventory results are incorporated into internal management review processes and reported to the Board of Directors on a quarterly basis, strengthening board-level oversight and participation in climate-related decision-making.
Scope 1 and Scope 2 Emissions Management
The Company continuously reduces the impact of operational activities on greenhouse gas emissions through energy efficiency management, process and equipment optimization, and control of purchased energy consumption for Scope 1 and Scope 2 emissions. In recent years, the emissions structure has remained relatively stable, indicating a high concentration of major emission sources and enabling management resources to focus on key reduction areas.
Scope 3 Emissions Management
The Company is progressively advancing the inventory and disclosure of Scope 3 greenhouse gas emissions, covering major categories including purchased goods and services, upstream and downstream transportation and distribution, waste generated in operations, business travel, employee commuting, and the use of sold products. In 2025, additional categories including capital goods, upstream leased assets, downstream leased assets, and investments were incorporated. Changes in Scope 3 emissions reflect not only business growth driven by increased revenue, but also the expansion of inventory boundaries and improved data coverage.
2025 Greenhouse Gas Emissions
- Scope 1: 16,008.534 tCO₂e (2.07%; YoY▲+8.51%)
- Scope 2: 105,646.680 tCO₂e (13.65%; YoY▲ +14.31%)
- Scope 1 + Scope 2: 121,655.214 tCO₂e (YoY▲ +13.51%)
- Scope 3: 652,145.600 tCO₂e (84.28%; YoY▲+60.75%)
Variance Analysis:
- Increase in Scope 1 and Scope 2 emissions → Expansion of operational scale and increased production capacity at certain sites.
- Increase in Scope 3 emissions → Expanded reporting boundaries and improved coverage rate.
Greenhouse Gas Emissions and Intensity
| Item | 2021(Base Year) | 2023 | 2024 | 2025 | ||||
| Emissions | Emissions Intensity | Emissions | Emissions Intensity | Emissions | Emissions Intensity | Emissions | Emissions Intensity |
|
| Scope 1 | 10,331.503 | 9.618 | 13,223.756 | 11.841 | 14,753.179 | 13.279 | 16,008.534 | 12.631 |
| Scope 2 (Location-based) | 125,705.482 | 117.029 | 93,958.568 | 84.133 | 92,418.607 | 83.182 | 105,646.680 | 83.360 |
| Scope 2 (Market-based) | - | - | - | - | - | - | 112,500.150 | 88.768 |
| Scope 3 | 232,650.359 | 216.592 | 233,235.361 | 208.845 | 405,700.662 | 365.152 | 652,145.600 | 514.574 |
| Scope 1, 2(Location-based) | 136,036.984 | 126.647 | 107,182.324 | 95.974 | 107,171.786 | 96.460 | 121,655.214 | 95.992 |
| Scope 1,2,3(Location-based) | 368,687.343 | 343.239 | 340,417.685 | 304.819 | 512,872.447 | 461.613 | 773,800.813 | 610.566 |










-
We sincerely welcome any suggestions regarding this Report.
Irene Sun
Corporation Relations Office
Email: Getac.csr@getac.com.tw -
Irregular Business Conduct Reporting
Lisa Kung
Director of Auditing Office
Email: gtcaudit@getac.com.tw